Graphing presentation times with R/ggplot2
I’ve been kicking around this bit of R code for the last couple of months, and so I thought I would share it.
First off, a little background. At work, we have a noon meeting every Tuesday where each team in the engineering department gets up in front of the rest of us and gives a little update on their progress from the last week. Well, over time this meeting grew in length, so a couple of months ago the suggestion was made to limit the length of the meeting to five minutes, which would give each team about 45 seconds to speak. I took the opportunity to capture how long each team took, and so now I have a bit of data to play with.
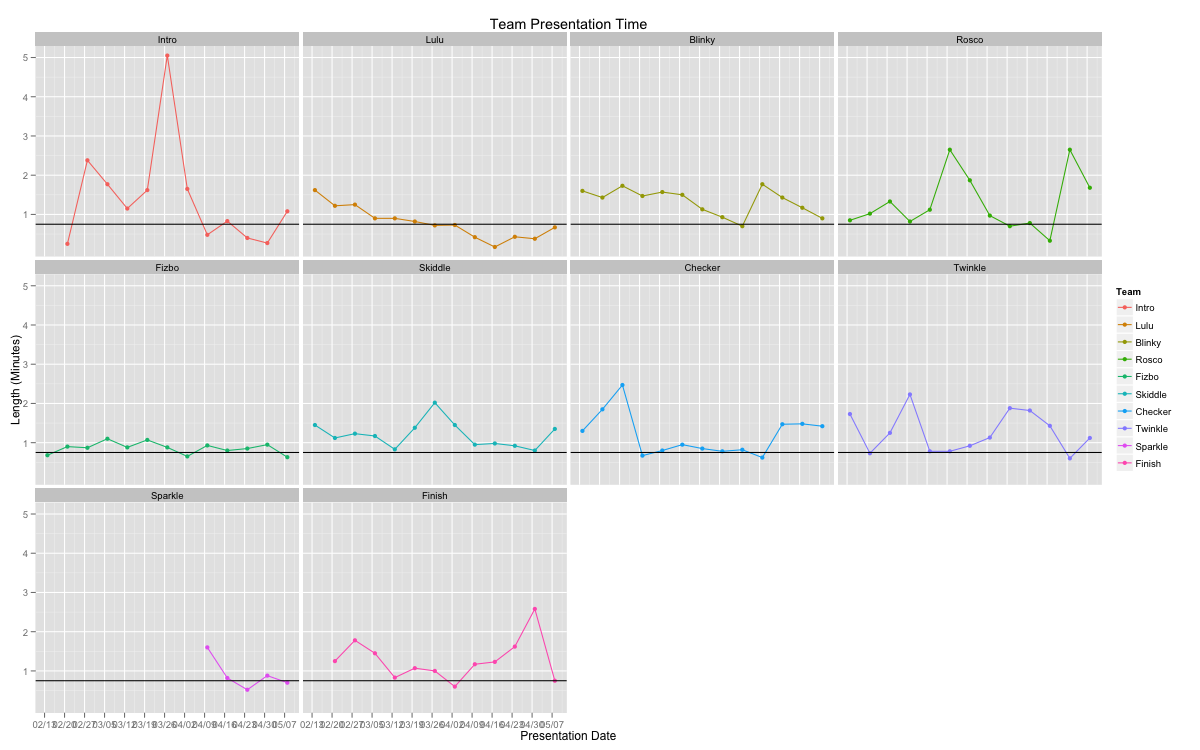
These graphs show how each individual team is doing 1. Click for larger version.
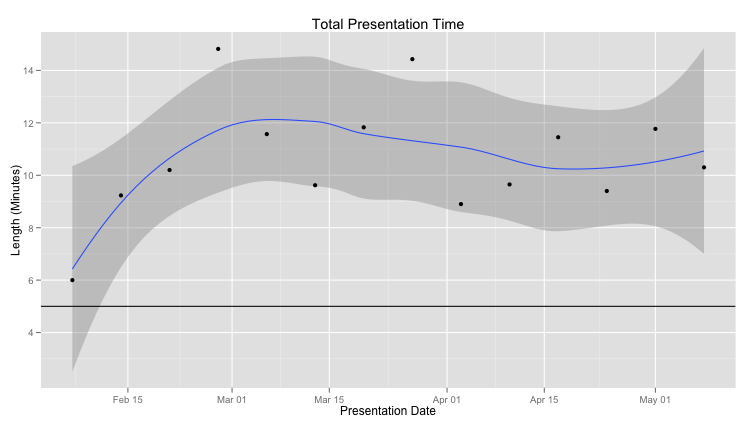
And this graph shows how the total meeting time looks. Click for larger version.
While we have never cleared the five minute goal, the meeting is still much more efficient than it was before.
The R code for this can be found on github. I feel like each time I use R, I’m a little more comfortable, but I still feel like I struggle with simple tasks for too long.
Enjoy.
-
Team names changed to protect the innocent. Why clown names? It just came to me. ↩︎

