Git submodules vs. subtrees for vim plugins, part 2
When I talked about submodules vs. subtrees before, one of the things I listed as a benefit for subtrees was the speed of the initial clone. I’d written a few scripts to help me benchmark the two, and with a little extra time that I have this weekend, I thought I’d share the data.
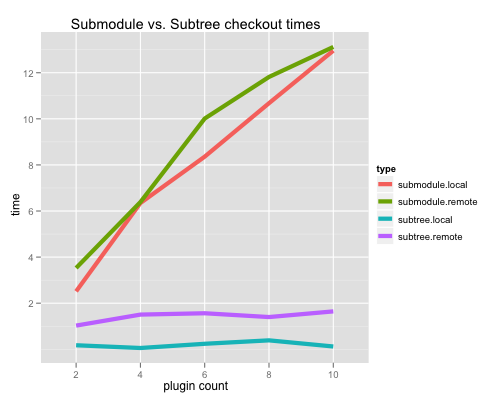
I generated 2, 4, 6, 8, and 10 plugin repositories for both submodules and subtrees and cloned each one ten times over both a local and a remote connection. Here is the result:
As you can see, submodules take longer for each one you add and subtrees stay pretty much the same. Here’s the R code to generate the above graph:
#!/usr/bin/env Rscript

library(ggplot2) # load up the ggplot2 library

# load up the data from the google csv export
smst <- read.csv('data.csv')

# add names to the data
names(smst) <- c('type', 'count', 'time')

# force count to be a factor instead of a continuous variable
smst$count <- factor(smst$count)

# calculate the mean for each type/count group
smst_mean <- aggregate(list(time=smst$time), list(type=smst$type, count=smst$count), mean)

png(filename = "submodule_vs_subtree.png", width=700, height=700)

ggplot(smst_mean, aes(x=count, y=time, group=type, color=type)) + geom_line(size = 2) + ylab("time") + xlab("plugin count") + opts(title = "Submodule vs. Subtree checkout times")
The generation and benchmarking scripts as well as the reported data and code are in my submodule_vs_subtree repo on github.
Read other posts
