How much does each stimulus job cost?
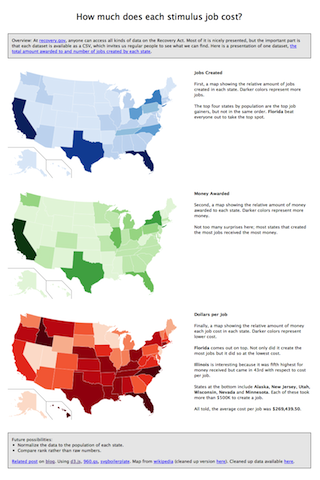
While reading a recent article on Edward Tufte, I went over to recovery.gov and came across a data set that details how much money each state has received and how many jobs were created. I’d just found out about d3.js and so I used it to create a visualization of how much each job cost:
Read other posts
